Last updated 11 August 2026. This page was reviewed on that date. Prices, rates and opening hours change often in Singapore — confirm anything that matters directly with the business before you travel or spend.
Quick answer: Singapore has several established private cardiology clinics offering consultations, diagnostics (ECG, echocardiography, stress tests), and interventional procedures — mostly around Mount Elizabeth, Novena, and Gleneagles medical centres. This directory lists five, with current contact details. This is directory information only, not a recommendation for your specific condition — always consult a licensed cardiologist directly.
Most clinic searches blend into a blur of aircon waiting rooms and similar websites. This directory steps aside from ranking lists to note five cardiologist practices in Singapore where a specific detail—a quiet first, an unusual depth, a focused subspecialty—gives the search a point of difference. For readers who like their medical choices with a footnote worth remembering.

Looking for a cardiologist in Singapore? Below are five established private cardiology practices, with verified contact details and the services each offers.

| Practice | Clinical focus | Where |
|---|---|---|
| ACE Cardiology Clinic | Interventional cardiology; treadmill ECG, echocardiography, 24-hour Holter monitoring | Mount Elizabeth Medical Centre |
| The Heart and Vascular Centre | Interventional cardiology — angioplasty, stenting, catheter ablation; cardiac rehabilitation | Multi-location, including Novena |
| Peter Yan Cardiology Clinic | Consultations, Holter and ambulatory blood pressure monitoring | Gleneagles Medical Centre, Napier Road |
| Capital Heart Centre | Cardiac MRI, CT coronary angiography and stress echocardiography under one roof | Mount Elizabeth Novena Hospital |
| The Heart Specialist Clinic | Electrophysiology and pacing alongside general cardiac care; four cardiologists | Mount Elizabeth Medical Centre |
1. ACE Cardiology Clinic
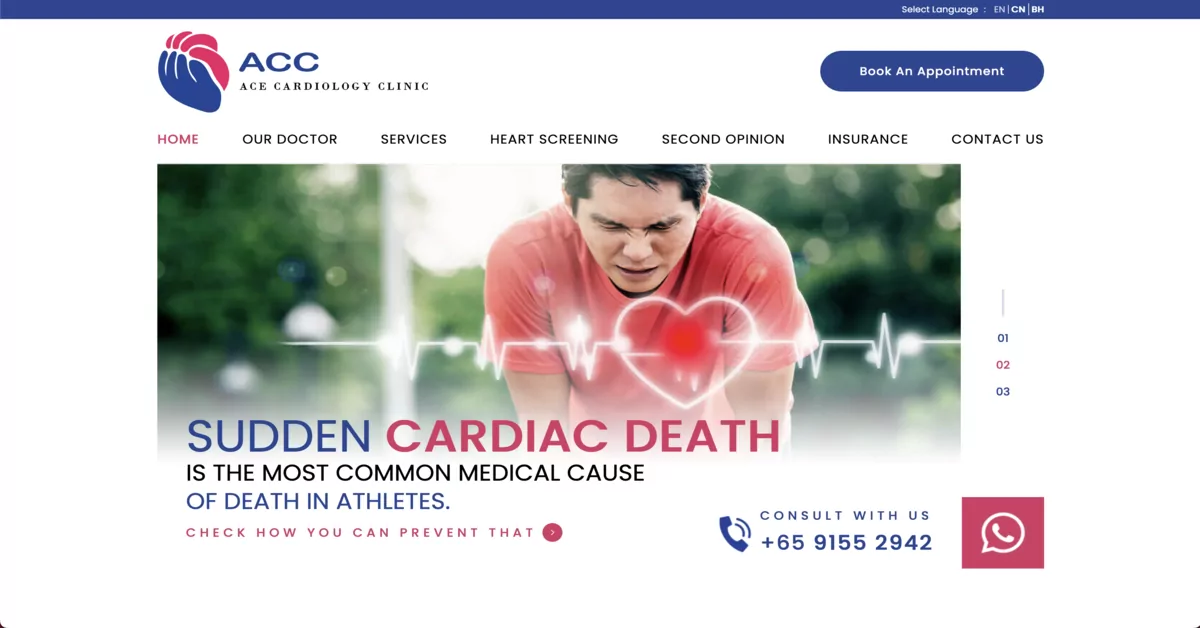
ACE Cardiology Clinic Pte. Ltd. is based at Mount Elizabeth Medical Centre, led by Dr Ang Teck Kee, a cardiologist specialising in interventional cardiology with over 20 years of clinical experience and over 3,000 coronary angiographies/interventions performed.
For those who know exactly what they need and just want a senior pair of hands without the fluff, this is the spot. Dr Ang’s long hours tucked among the Mount E suites mean you can sometimes squeeze into a last-minute slot when other clinics are fully booked. Just be clear about what tests you really want—skip the atas extras and you’ll walk out with a plan that’s solid and wallet-friendly.
Services
- Cardiac investigations: treadmill ECG, echocardiography, 24-hour Holter monitoring
- Chronic condition management: atrial fibrillation, heart failure, hypertension
- Symptom evaluation: chest pain, palpitations, shortness of breath
- Cardiac screening for those with risk factors or family history
Contact & Location
- Address: 3 Mount Elizabeth, #17-18, Mount Elizabeth Medical Centre, Singapore 228510
- Hours: Mon–Fri 9:00am–5:00pm, Sat 9:00am–12:00pm, closed Sun & PH
- Phone: +65 6235 7536 / +65 9155 2942
- Website: acecardiologyclinic.com
For patients who take quiet comfort in high-volume procedural experience, Dr Ang’s background in over 3,000 coronary interventions offers a steady, numbers-backed approach. The Mount Elizabeth Medical Centre location adds an unhurried, established feel. It suits those who prefer a cardiologist with a case log that speaks for itself, in a setting that feels reassuringly conventional.
2. The Heart and Vascular Centre
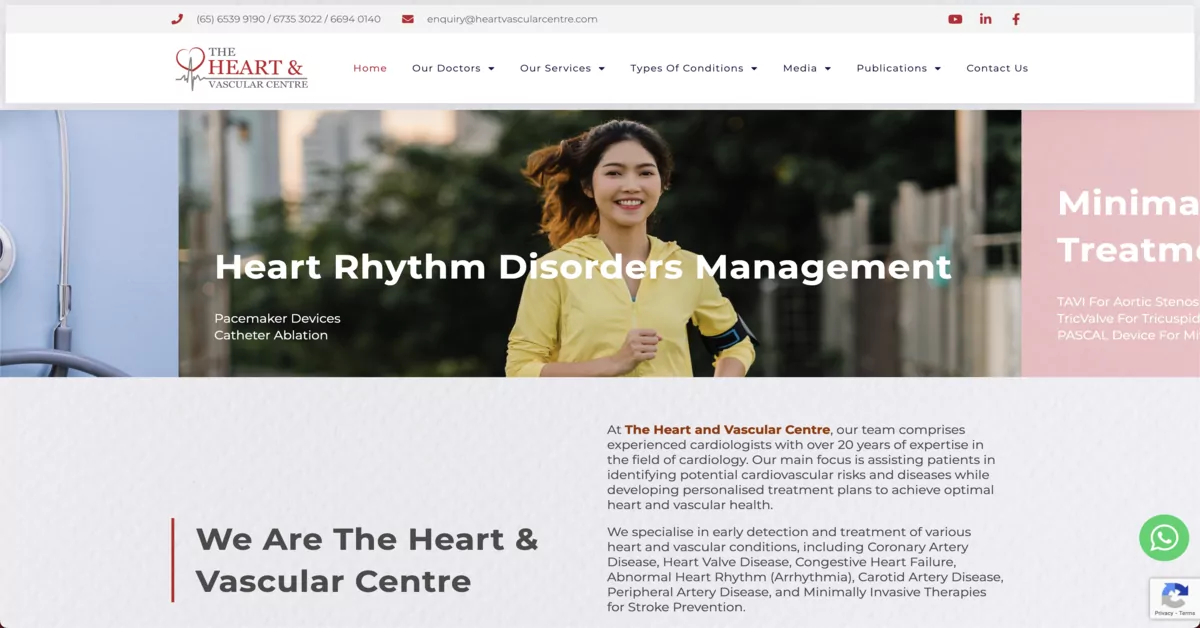
The Heart and Vascular Centre Pte. Ltd. is a multi-location cardiology practice; the practice is led by Dr Paul Chiam, an interventional cardiologist credited with leading the team that performed Asia’s first transcatheter aortic valve replacement (TAVR).
Multi-location means you can pick the branch nearest your HDB kopitiam; you’ll save on Grab, and the consultation might sit gentler on your wallet than the Orchard flagship. The team does high-volume advanced stuff, so their insurance billing is sorted—no blur like sotong mistakes that leave you hanging. If you need serious skill like TAVR, Dr Chiam is the name dropped quietly but with serious respect.
Services
- Diagnostic cardiology: ECG, echocardiogram, stress testing
- Interventional cardiology: angioplasty, stenting, catheter ablation
- Preventive cardiology and risk assessment
- Cardiac rehabilitation
Contact & Location
- Address (Novena): 38 Irrawaddy Road, #09-21, Mount Elizabeth Novena Specialist Centre, Singapore 329563
- Hours: check heartvascularcentre.com for current hours (may vary by location)
- Phone: +65 6694 0140
- Website: heartvascularcentre.com
- Also has clinics at Orchard and Gleneagles — check the website for those locations.
A practice that wears its firsts lightly—Dr Chiam’s involvement in Asia’s inaugural TAVR gives the centre a window into structural heart intervention that is still uncommon. Suits someone who wants a cardiologist comfortable at the frontier without the fanfare. The multi-location presence adds a note of quiet convenience.
3. Peter Yan Cardiology Clinic
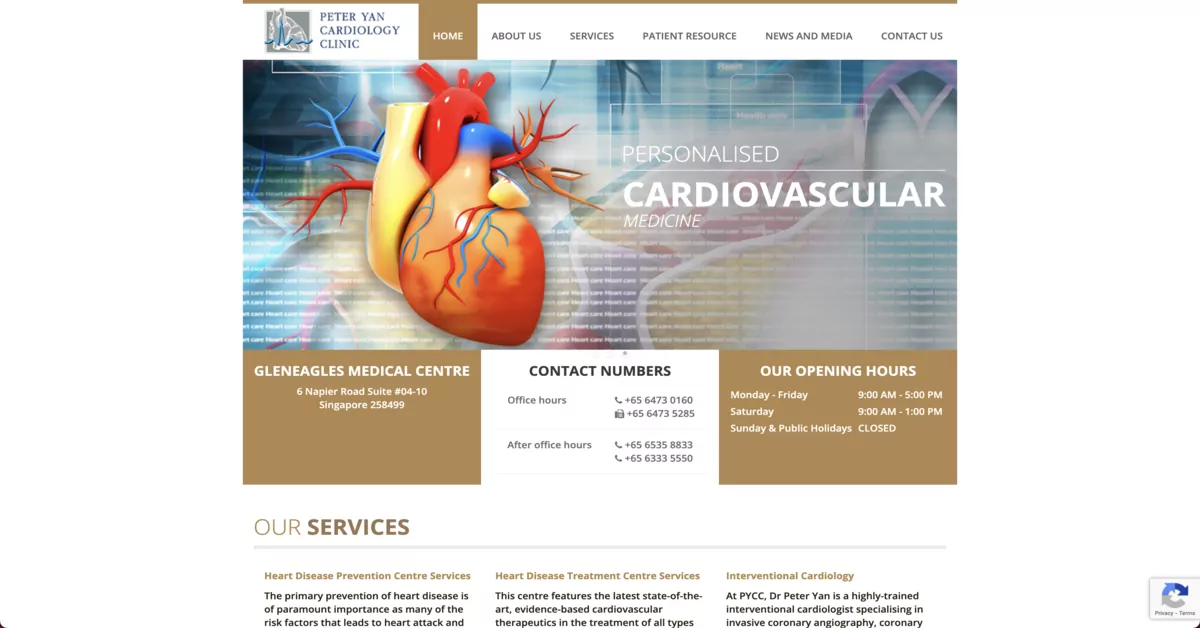
Peter Yan Medical Services Pte Ltd, trading as Peter Yan Cardiology Clinic, is led by Dr Peter Yan, a cardiologist with over 25 years of experience who introduced coronary angioplasty and the coronary stent programme to National University Hospital’s Cardiac Department in the 1980s.
Dr Yan has been in the game since back when heart stenting was new in Singapore—he literally wrote the programme. His clinic doesn’t try to look like a luxury spa, which means the fees don’t have that extra fluff. You come for decades of steady hands, not for fancy kopi in the waiting room.
Services
- Consultations for heart-related concerns
- Diagnostic tests: Holter monitoring, ambulatory blood pressure monitoring
- Customised treatment plans for heart conditions
Contact & Location
- Address: 6 Napier Road, Suite #04-10, Gleneagles Medical Centre, Singapore 258499
- Hours: Mon–Fri 9:00am–5:00pm, Sat 9:00am–1:00pm, closed Sun & PH
- Phone: +65 6473 0160
- Website: cardiology.com.sg
A clinic anchored by a cardiologist who helped shape interventional practice at a national hospital decades ago. The weight of that institutional memory might appeal to patients who value a lineage of clinical teaching alongside personal care. It is a practice where history sits in the consultation room, not just on a plaque.
4. Capital Heart Centre

Capital Heart Centre Pte. Ltd. is based at Mount Elizabeth Novena Hospital, led by Dr Joshua Loh, a Senior Consultant Cardiologist with over 20 years of experience specialising in interventional cardiology.
If you hate running from one clinic to another for tests, this place does the heavy-duty scans like cardiac MRI under one roof, so you save on transport and the hassle of multiple appointments. The setup is slick but not atas—efficiency seems to be their real product, and that can keep your bill lean.
Services
- Non-invasive imaging: cardiac MRI, CT coronary angiography, stress echocardiography
- Invasive/minimally invasive procedures: coronary angioplasty, stenting, pacemaker implantation, cardiac ablation
- Heart failure management
Contact & Location
- Address: 38 Irrawaddy Road, #06-48/49, Mount Elizabeth Novena Hospital, Singapore 329563
- Phone: +65 6681 5677 / +65 8071 5822
- Email: [email protected]
- Website: capitalheart.sg
A straightforward, solid choice for interventional cardiology in the newer wing of Mount Elizabeth Novena. The practice feels streamlined—suits anyone who prefers a direct consultant-led approach without an elaborate front-of-house. Appointments tend to move at a measured pace, with the specialist driving the conversation.
5. The Heart Specialist Clinic

The Heart Specialist Clinic Pte Ltd, established in 2000 by Dr Teo Wee Siong, is a multi-doctor cardiology practice (Dr Teo, Dr Lim Tiong Keng, Dr Chee Tek Siong, Dr Paul Lim) specialising in electrophysiology and pacing alongside general cardiac care.
This isn’t a one-man show—four seasoned cardiologists under one roof means you can often snag a same-week appointment when other clinics tell you to wait. If you’re the kiasu type who wants a second opinion without walking next door, it’s here in one sitting. And because they specialise in heart rhythm, they’ll pinpoint that fluttering without ordering every scan under the sun.
Services
- Preventive screenings for heart disease risk
- Interventional procedures: coronary angiography, pacemaker implantation
- Arrhythmia treatment and implantable devices
Contact & Location
- Address: 3 Mount Elizabeth, #14-09/10, Mount Elizabeth Medical Centre, Singapore 228510
- Phone: +65 6690 4195
- Website: theheartspecialistclinic.com
For a heart that occasionally decides to freestyle its rhythm, a practice where electrophysiology is the main act — not a footnote — feels logically sound. Four cardiologists share the load, so you are covered when Dr Teo is overseas. The Mount Elizabeth premises are quietly anonymous, which is precisely the point for a visit you want to be unmemorable.
FAQs about seeing a cardiologist in Singapore
Do I need a referral to see a cardiologist in Singapore?
Private cardiology clinics generally accept self-referrals, though your GP or polyclinic can also refer you, and a referral may affect insurance/Medisave claim eligibility depending on your plan.
Before you chope a slot, know this: some private cardiologists waive first-consult fees if you bring a polyclinic referral—tapau that letter from your GP to unlock Medisave for certain scans. Off-peak slots midweek often have shorter waits; ask the receptionist softly if any ‘package’ rates for basic heart screening exist. Not everyone knows, so you’re one step ahead.
What’s the difference between diagnostic and interventional cardiology?
Diagnostic cardiology covers tests like ECG, echocardiography, and stress testing to identify heart conditions. Interventional cardiology covers procedures that treat conditions directly, such as angioplasty, stenting, and catheter ablation.
When should I see a cardiologist?
Common reasons include chest pain, palpitations, shortness of breath, a family history of heart disease, or as part of preventive screening if you have risk factors like high blood pressure or diabetes. Seek urgent/emergency care immediately for severe chest pain or suspected heart attack symptoms — don’t wait for a clinic appointment.
Last updated July 2026. Clinic addresses, phone numbers, and doctor details cross-checked against each clinic’s own website and hospital specialist directories on 22 July 2026 — several addresses differed from earlier records, suggesting unit relocations; contact the clinic directly to confirm before visiting.
Disclaimer
This article is for general information only and does not constitute medical advice. It is not an endorsement or ranking of any clinic or doctor. Always consult a licensed medical professional for diagnosis and treatment of any health condition. Information has been compiled from publicly available sources and clinics’ own websites; while we aim for accuracy, confirm current details directly with the clinic before visiting. Let us know if you spot anything that needs correcting.
Wise move to read this—saves you from thinking a cardiologist’s mention here is a golden endorsement. It’s not. Still, use the directory as a starting point, then double-check clinic reviews on your own. If you’re kiasu about insurance, call the clinic to confirm your plan’s coverage before booking; that way, no surprise bills to spoil your kopi moment.